From a developer's diary: OOM nightmares
A performance‑testing deep‑dive into a lingering OOM that resurfaced after months, exposing hidden thread‑leaks and the importance of robust timeout handling.
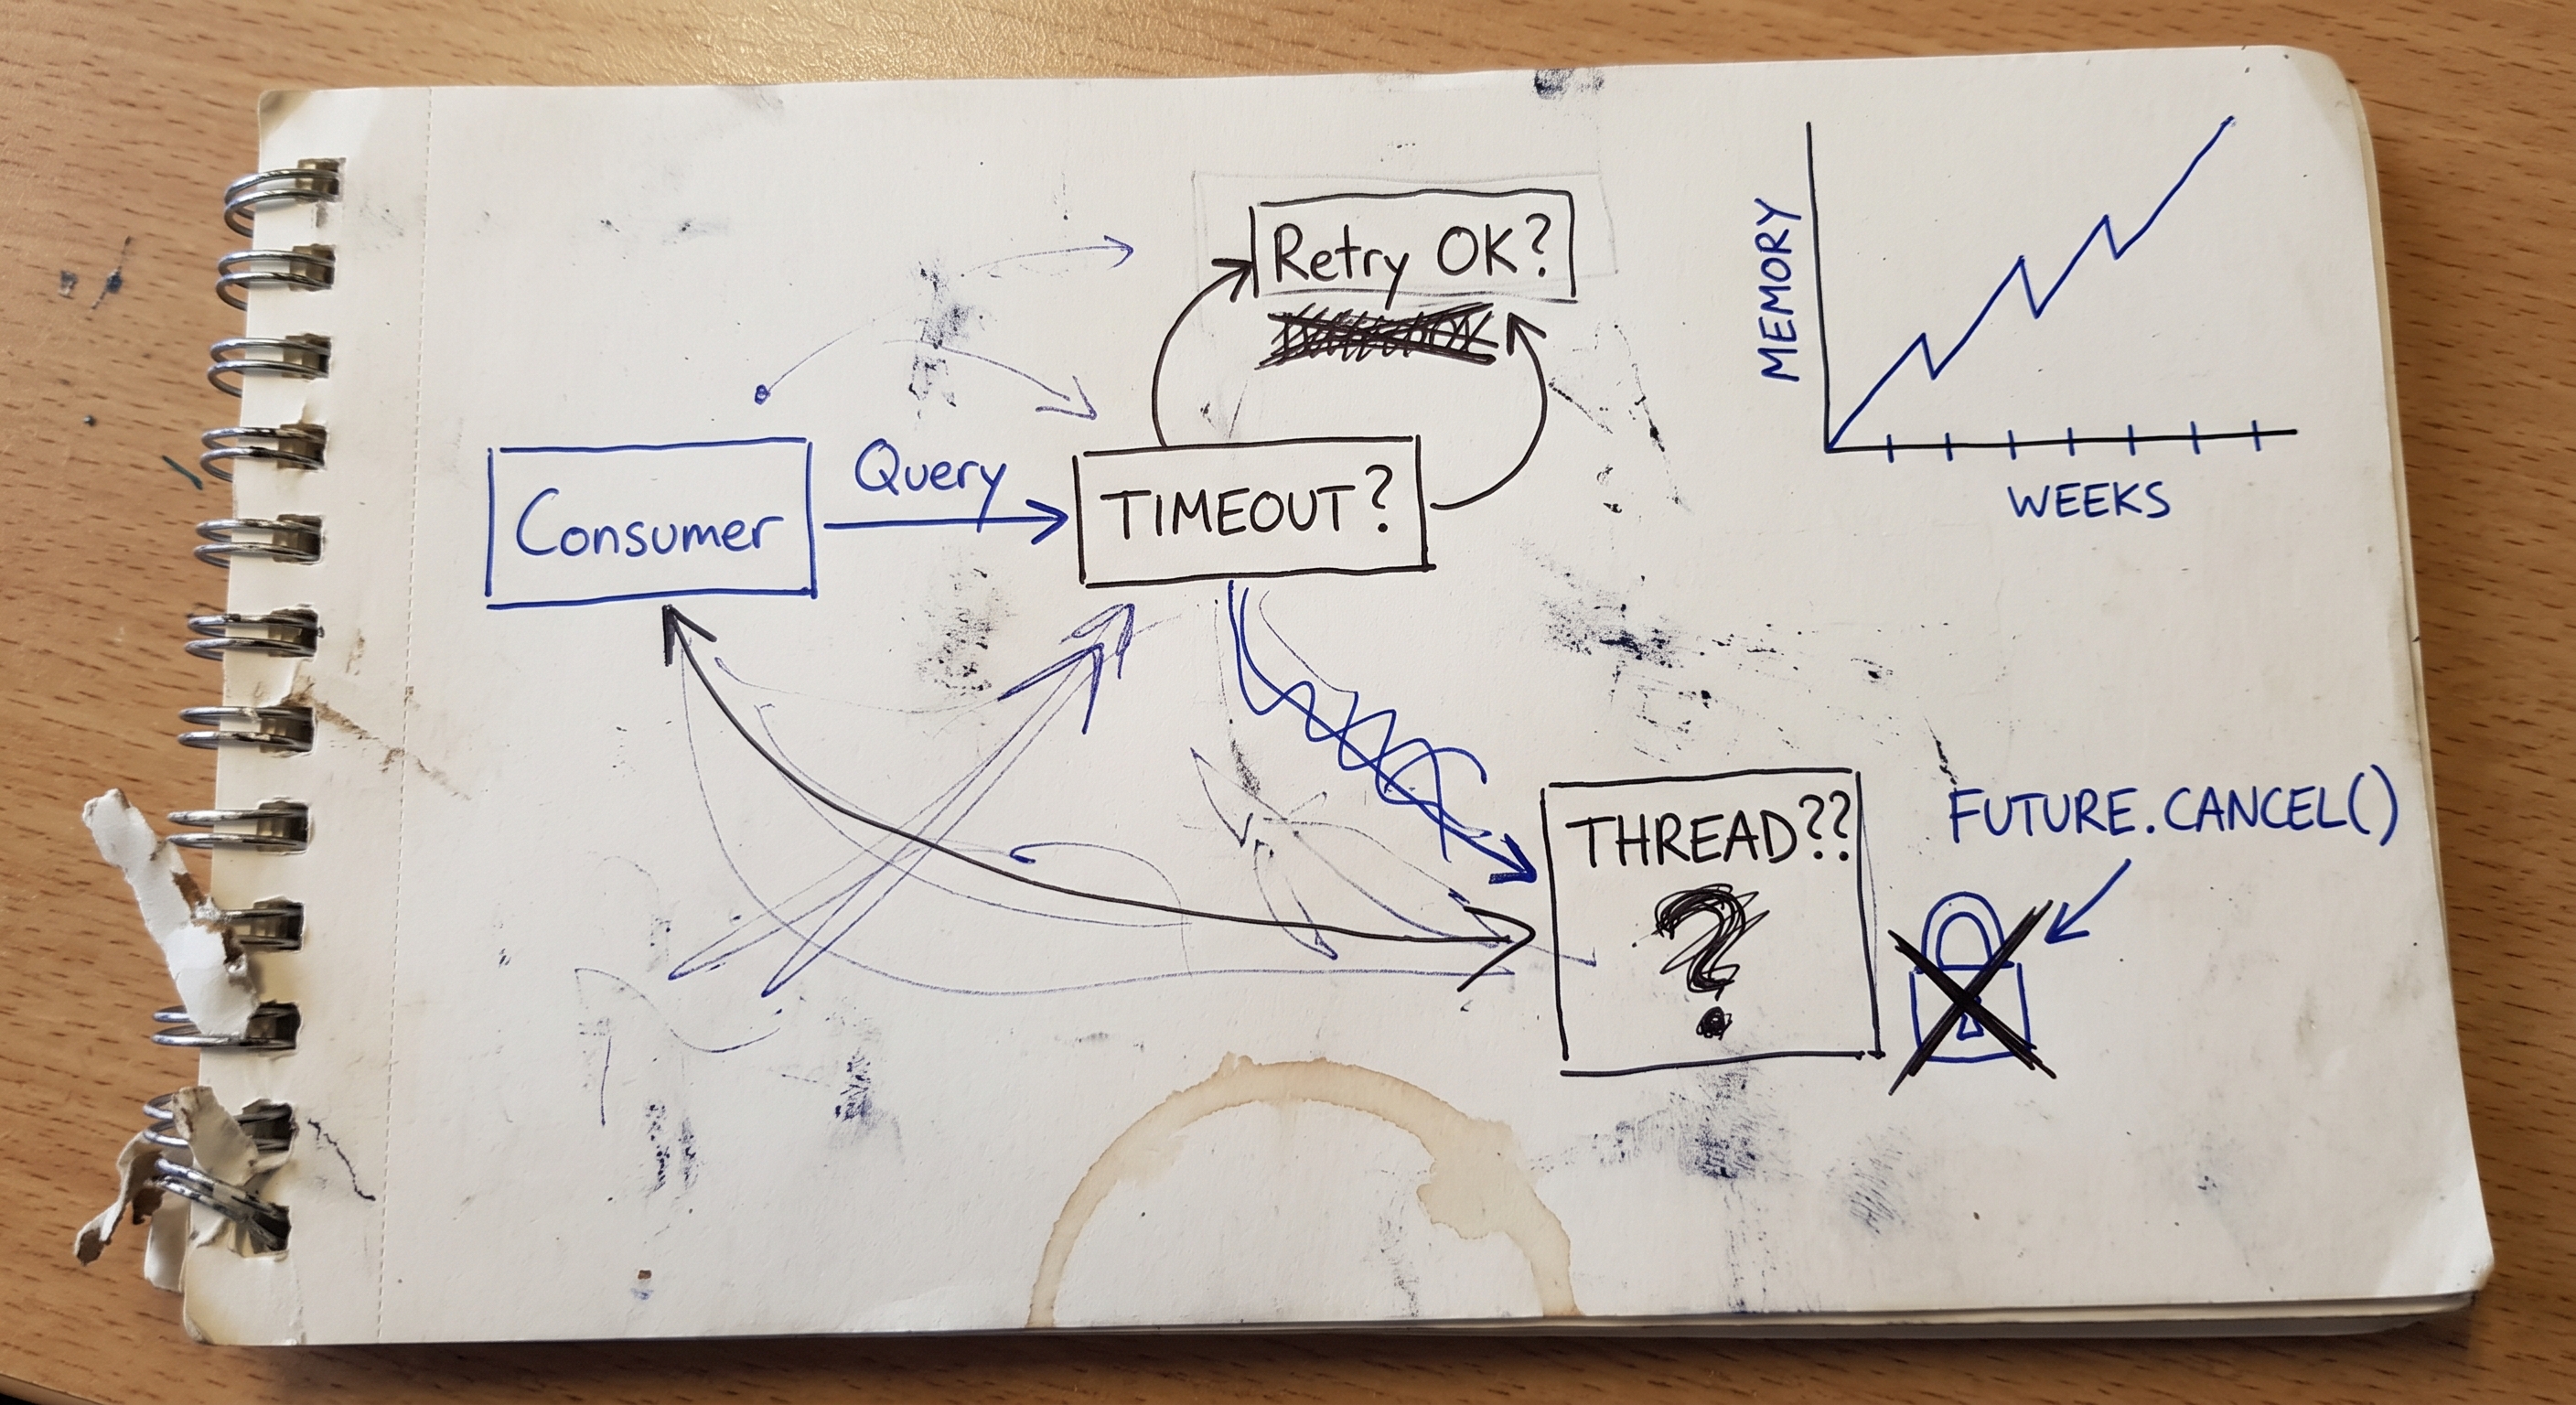
I'm deep in performance testing right now on an app. The gist is finding bugs, fixing them, trimming memory and CPU wherever it's wasted, that kind of grind where you can actually see the numbers move.
It rekindled a memory of an older OOM, one I hadn't thought about in a while. That one was on a different app entirely, part of a large OTT platform, real critical piece, the kind where a slow query or a leaked thread eventually shows up as someone's stream buffering and it is not a great experience when users are trying to wind down in front of TV.
That one hit a production app after three quiet months with no releases, following twelve straight months of shipping monthly. No new code, no new traffic pattern, nothing obviously different. Just a pod that had been fine for 3 months suddenly going down with OOM.
Sounds strange when you say it like that. No release, so why would anything change? The honest answer is that nothing did change. The app had been broken the entire time. It just took three months of nobody touching it for the break to finally show itself.
The OOM That Reminded Me of an Older OOM
I'm deep in performance testing right now on an app. The gist is finding bugs, fixing them, trimming memory and CPU wherever it's wasted, that kind of grind where you can actually see the numbers move.
It rekindled a memory of an older OOM, one I hadn't thought about in a while. That one was on a different app entirely, part of a large OTT platform, real critical piece, the kind where a slow query or a leaked thread eventually shows up as someone's stream buffering and it is not a great experience when users are trying to wind down in front of TV.
That one hit a production app after three quiet months with no releases, following twelve straight months of shipping monthly. No new code, no new traffic pattern, nothing obviously different. Just a pod that had been fine for 3 months suddenly going down with OOM.
Sounds strange when you say it like that. No release, so why would anything change? The honest answer is that nothing did change. The app had been broken the entire time. It just took three months of nobody touching it for the break to finally show itself.
The first pass
The first thing anyone found in the logs was a timeout. Not a frequent one. This particular report could get enormous once in a while, depending on what was being pulled, and the query behind it had already been tuned as far as it reasonably could be. Past a certain size there just wasn't much more to squeeze out, so a retry had been added as a safety net for the rare case a run took too long. And it worked. When that happened the pattern was always the same: query times out, and when it does, the message gets redelivered, retry runs clean (most of the times without timeout again), report gets generated. Case closed, in everyone's head.
It took a heap dump and a thread dump to show us we were wrong. Well, we were right in the design. Wrong in the implementation. Sitting in the thread dump were threads from timeouts going back weeks, still alive, still holding ResultSets and CSV objects that nothing was ever going to use again. The timeout wasn't just a nuisance we'd already solved with retries. It was leaving a small permanent piece of memory behind every single time it happened.
And it had been happening throughout the twelve months of monthly releases before this quiet stretch too. Rare, maybe once every few weeks when a big enough report came through, but the behavior was identical every time. The only difference was that every release tore the pod down and built a fresh one, so none of it ever had the chance to add up to anything visible.
The setup
There was a consumer in the system that read a message, fired off a set of queries, built a report, and moved on to the next one. It was configured to process one report request at a time. On paper, single threaded. Predictable. Nothing exotic.
The queries themselves went through something that had been built a while back, a native query executor, similar to a utility that most apps would have for running DB queries.
If a query hung, the thread running it didn't come back. The message lock expired because the processing took longer than the lock duration. The consumer didn't wait around for it though, and the message queue did its part too. The message that triggered the timed-out query got redelivered, picked up again, and processed clean on the retry. Report generated, nothing missing downstream.
What the retry didn't touch was the first attempt. Its thread stayed alive in the background, holding the ResultSet in memory, and holding a CSV object built from that ResultSet, so the same data twice over. The future.cancel() call that was supposed to be cleaning things up wasn't actually interrupting anything, because the JDBC driver didn't check the interrupt flag while it was blocked waiting on the database. Cancel just marked the future as cancelled. The thread itself never got the message, and nothing downstream ever needed it again either. It just sat there, forgotten, holding memory hostage.
Bug age versus bug visibility
We had assumed that fifteen months in production without a JVM incident meant the code was solid in performance terms. What it actually meant was that the conditions needed to trigger the bug hadn't happened yet. The monthly release cycle, which had been built for shipping fast, was also resetting the JVM often enough that this particular leak never got the runway to matter.
What we changed
- Query timeouts needed to happen at the database level, not just as a future we cancelled and hoped for the best with.
statement.setQueryTimeout()got the driver itself to abort the query, which actually stopped the work instead of just abandoning our reference to it. - When a timeout happened, we started forcibly closing the underlying connection rather than trusting cancellation to do the job. Closing the connection was the one thing that reliably made the driver give up.
- We bounded the thread pool so a string of timeouts couldn't spin up unlimited threads even in the worst case. It didn't fix the leak by itself, but it put a ceiling on how fast things could go wrong.
- ResultSets got streamed straight into CSV output instead of being held fully in memory alongside the CSV object. No reason to pay for the data twice. Very important but late realization.
Soak tests had existed already, running for 12 to 24 hours before each release. Two things worked against them here. The timeout depended on a report large enough to push the query past its limit, and that size of report didn't show up on demand, so the test often didn't hit the condition at all. And even on a run where it did hit, 12 to 24 hours wasn't enough time for the leak to accumulate to the point of an OOM at this scale. We extended soak duration and started injecting artificial slow queries directly into the test environment so the timeout path got exercised on purpose and given enough time to matter.
A soak test only tells you something if it both reaches the failure condition and runs long enough for the consequences to show up. Ours was missing both.
Back to the present
None of this is directly relevant to what I'm working on now. Different app, different problem, different constraints I can't get into. But going through a performance test phase again put me back in that same headspace: chasing a number that's a little worse than it should be, and asking whether the explanation in front of me is the whole explanation or just the part that happened to get logged.
The old bug is a reminder to keep asking that question even after a fix ships and the graphs look fine. Fine for now isn't the same as fixed, and the gap between the two doesn't always announce itself. Sometimes it just waits for the schedule to change.